
Welcome to the Office of Insitutional Effectiveness
Please click the three lines on the left of the screen to access Data Dashboards and other information. Additional resources for faculty and staff may be found on the Institutional Effectiveness SharePoint site.
What's New
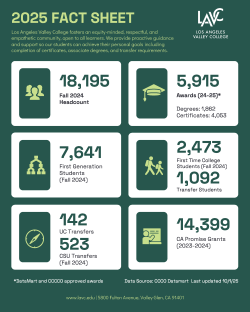
Established: June 1949
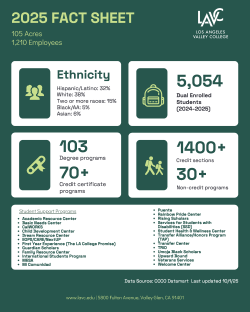
Campus: Located on 105 - acres in the eastern San Fernando Valley
Fact Sheet and Institutional Profile
Special programs, accreditation and other information about LAVC
- ACCJC LAVC Institutional Data
- Student Profile/ Headcount & Demographics Fall
- IPEDS - Feedback Report 2024
- Student Success Metrics - CalPass (CCCCO)
- ASSIST.ORG (course information)
- Carnegie Classification
- School Colors: Green and Yellow
- Mascot: Monarch Lion
- Tree Campus USA
- LAVC Athletics: Baseball, Basketball (Men’s & Women’s), Football, Softball, Soccer (Women’s), Swimming & Diving, Water Polo (Men’s & Women’s)
- Special Programs
- Community Services – Lifelong learning and training classes for the community
- Continuing Education Non Credit Programs – ESL, learning skills, and licensure classes
- Cooperative Education – College credit for work experience
- Dual Enrollment [formerly ACE (Advanced College Enrollment)] – College-level courses for high school students
- Job Training – Career training programs
- Service Learning Program
- TAP (Transfer Alliance/Honors Program) – Honors classes for transferring to a university
- Valley College Online Program
- Special Programs
- Mosaic Center - Dream Resource Center, Rainbow Pride Center, UMOJA Community/ Black Scholars, Veterans Services
- PUENTE Cohort
- Accredited by the Accrediting Commission for Community and Junior Colleges (ACCJC)
- Member of the American Association of Community Colleges (AACC)
- A Hispanic Serving Institution
Enrollment
Enrollment trends (headcount & FTES) from 2012-2024
| Academic Year | Annual Headcount | Fall Headcount | Annual FTES |
|---|---|---|---|
| 2024-2025 | 30,677 | 18,139 | 11,195.96 |
| 2023-2024 | 30,225 | 17,729 | 10,804.32 |
| 2022-2023 | 27,178 | 16,555 | 10,036.46 |
| 2021-2022 | 24,468 | 15,061 | 8,858.15 |
| 2020-2021 | 26,062 | 16,494 | 10,206.65 |
| 2019-2020 | 26,796 | 16,915 | 10,965.18 |
| 2018-2019 | 26,969 | 17,785 | 11,841.41 |
| 2017-2018 | 26,624 | 16,515 | 12,115.96 |
| 2016-2017 | 27,568 | 17,500 | 11,785.80 |
| 2015-2016 | 27,959 | 19,080 | 12,018.41 |
| 2014-2015 | 27,880 | 19,301 | 11,928.51 |
| 2013-2014 | 28,203 | 19,174 | 11,815.13 |
| 2012-2013 | 26,607 | 19,236 | 10,789.70 |
|
Source: https://datamart.cccco.edu/Students/Student_Term_Annual_Count.aspx; https://datamart.cccco.edu/Students/FTES_Summary.aspx last updated 8/9/24 |
|||
*Click here for more on LAVC Headcount & Demographics
Academic Programs and Offerings
LAVC Degrees & Certificates
| 53 AA degrees | 66 Certificates of Achievement |
| 20 AS degrees | 10 Skills Certificates |
| 18 AT degrees | 46 Non-Credit Certificates |
| 11 ST degrees | 2 CY Certificate (competency) |
| 1 BS degree (RT) | 4 Digital Badge |
| 2 STU degrees (U. of CA Transfer Pathway) |
program count last updated 9/17/25
For a complete list of current programs see the campus catalog
Course Offerings: 1,409 credit sections; 135 non-credit sections (Fall 2024). Source: MIS Data Mart updated 4/3/25
Transfer and Completion
LAVC Transfer, Degree and Certificate Awards Data
- 142 UC Transfers (Fall 2024)
- Top Transfer Institutions: UCLA (61), UC San Diego (20), UC Berkeley (17), UC Santa Barbara (18) UC Irvine (12)
- 523 CSU Transfers (Fall 2024)
- Top Transfer Institutions: CSUN (426), CSLA (23), CSU Long Beach (15)
- Transfer GPA: 3.3
- Top Concentrations: Psychology, Sociology, Management, Accountancy, Art, Child Development, Political Science, Radio/TV, Kinesiology
- 87 Transfers to Out-of-State (OOS) institutions (2023-2024)
- 82 Transfers to In-State-Private (ISP) institutions (2023-2024)
- Cohort Transfer Rate = 6.62% (Source: 2023 Student Right to Know)
updated 7/28/25
Student Right to Know Completion Rates
In compliance with the Student Right-To-Know (SRTK) Act of 1990 (Public Law 101-542), Los Angeles Valley College makes available its completion and transfer rates to all current and prospective students.
Beginning in Fall 2018, a cohort of all certificate-, degree-, and transfer-seeking first-time, full-time students were tracked over a six-year period*. Their completion and transfer rates are listed above. These rates do not represent the success rates of the entire student population at the College nor do they account for student outcomes occurring after this six-year tracking period.
*Because LAVC now offers a baccalaureate program.
LOS ANGELES VALLEY COLLEGE COMPLETION AND TRANSFER RATES
Completion Rate: A student is included in the Completion Rate if they attained a certificate or degree or became “transfer prepared” within the six-year period (Fall 2018 to Spring 2024). Transfer-prepared is defined as having completed 60 transferable units with a GPA of 2.0 or better.
Transfer Rate: A student is included in the Transfer Rate if, within the six-year tracking period, they transferred to another postsecondary institution prior to receiving a certificate or degree or becoming “transfer-prepared” during a eleven semester period, from Spring 2019 to Spring 2024.
The table below compares Los Angeles Valley College’s Completion and Transfer Rates to the statewide community college average for Fall 2018 Cohort.
| Cohort (six-year period) | 2018 |
| Completion Rate | 32.12% |
| Transfer Rate | 8.79% |
(2025 available data)
Data Source: California Community Colleges Student Right-To-Know Rate Disclosure Website, http://srtk.cccco.edu/index.asp. This website includes information on the methodology, interpretation, statewide and other California Community Colleges completion rates and transfer rates.
Student Right to Know Data from 2013-2024 (please note: Completion Rate: A student is included in the Completion Rate if they attained a certificate or degree or became “transfer prepared” within the three-year period (Fall 2018 to Spring 2024; starting 2025, it is a six-year period).
Graduation rates of full-time, first-time, degree/certificate-seeking undergraduates within normal time, and 150% and 200% of normal time to completion: 2019 cohort
| 200% | 150% | 100% | |
| Graduation rate | 38.0% | 32.0% | 18.0% |
Graduation rates of full-time, first-time, degree/certificate-seeking undergraduates within 150% of normal time to program completion, by gender and race/ethnicity and transfer out-rate: 2020 cohort
| Overall graduation rates | |
| Total | 41.0% |
| Men | 39.0% |
| Women | 43.0% |
| Asian | 53.0% |
| Black or African American | 44.0% |
| Hispanic or Latino | 37.0% |
| White | 50.0% |
| Two or more races | 39.0% |
| Race/ethnicity unknown | 28.0% |
| U.S. Nonresident | 67.0% |
| Transfer out-rate | 8.0% |
Data Source: National Center for Educational Statistics - Integrated Postsecondary Education Data System (IPEDS) – Retention and Graduation: https://nces.ed.gov/ipeds/institution-profile/117733#retention-and-graduation
-
2023-2024 Awards – 4479 (total)
-
2,150 students received awards during 2023-2024
-
Awards (Completion Data) (interactive)
-
Cohort Completion Rate (Fall 2020) = 42.21% (Source: 2024 Student Right to Know)
| Count of Awards Granted by Type | ||
|---|---|---|
| Degree | Description | 2023-2024 |
| AA | Associate of Arts | 700 |
| AS | Associate of Science | 372 |
| AT | AA Transfer | 428 |
| ST | AS Transfer | 373 |
| C | Certificate of Achievement | 1727 |
| CS | Skill Certificate | 52 |
| CN | Non-Credit Certificate of Completion | 856 |
| CN | Certificate of Competency | 14 |
| Updated 4/30/25 | ||
LAVC Employee Data
Faculty, Staff and Other Employees
| Faculty | |||||||||||
| Year | 2025 | 2024 | 2023 | 2022 | 2021 | 2020 | 2019 | 2018 | 2017 | 2016 | 2015 |
| Full-Time | 212 | 213 | 193 | 192 | 195 | 205 | 202 | 202 | 213 | 201 | 186 |
| Part-Time | 421 | 381 | 415 | 449 | 404 | 423 | 441 | 451 | 396 | 432 | 471 |
| All Other Employees | |||||||||||
| Year | 2025 | 2024 | 2023 | 2022 | 2021 | 2020 | 2019 | 2018 | 2017 | 2016 | 2015 |
| Full-Time | 240 | 246 | 247 | 241 | 243 | 246 | 231 | 227 | 225 | 218 | 223 |
| Part-Time | 337 | 345 | 328 | 293 | 384 | 518 | 620 | 667 | 619 | 571 | 501 |
Source: LACCD Report for Department of Census Survey. Updated April 17, 2024
LAVC Student Profile
OIE Mission, Vision & Key Functions
The LAVC OIE supports all areas of the college by providing data for operations, planning, and decison-making.
- To provide background and achievement data about our students, employees and service area
- To evaluate college progress and refine our goals in order to improve our students’ success
- To assess college programs and services
- To evaluate and report meaningful measures of institutional effectiveness
- To analyze, interpret, and evaluate quantitative and qualitative data
- To assist in the design of campus research efforts
- To provide research and evaluation support for grant-writing endeavors
- To be a resource for implementing and assessing student learning outcomes (SLOs)
- To communicate data in accessible and timely manner to disseminate research findings for decision-making and planning purposes
- To facilitate accountability assessment and reporting efforts
- To provide quality data for positive action.
The Office of Institutional Effectiveness facilitates and supports campus-wide processes for evaluating the effectiveness of programs and the institution in order to foster sustainable continuous quality improvement. The Office of Institutional Effectiveness is coordinates and supports institutional efforts related to data, research, accountability, assessment for planning, goal-setting, and decision-making.
Updated 12/2015
The LAVC OIE strives for excellence, integrity, and ethics in our work and hold the highest standards in regard to the quality of the information we provide to the campus and community. The OIE strives to make data accessible to the college constituents and to facilitate data usage to support other processes.
Updated 12/2015